Rational Ground ● Members

The Economy in Charts

The economy behind the 2026 vote: jobs that weren't there, paychecks that shrank after the stimulus, and a gas-price shock. Sources are printed under each chart. Tap a chart to open it full size.
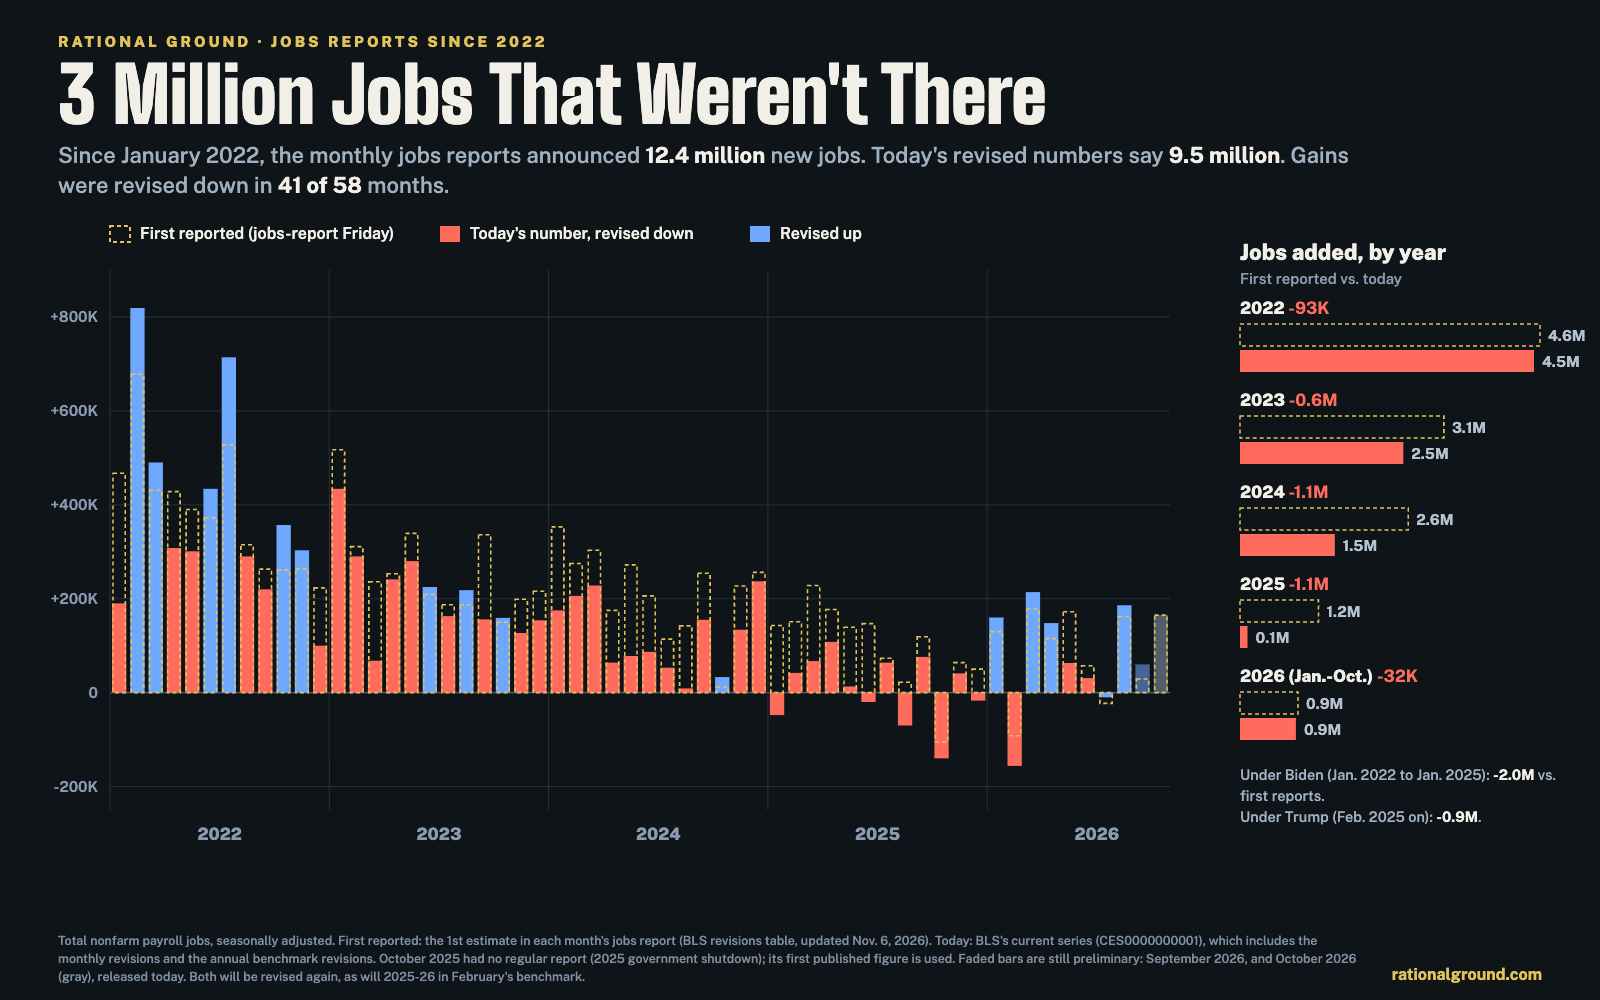
3 Million Jobs That Weren't There: Since January 2022, the monthly jobs reports announced 12.4 million new jobs. Today's revised numbers say 9.5 million. Gains were revised down in 41 of 58 months.
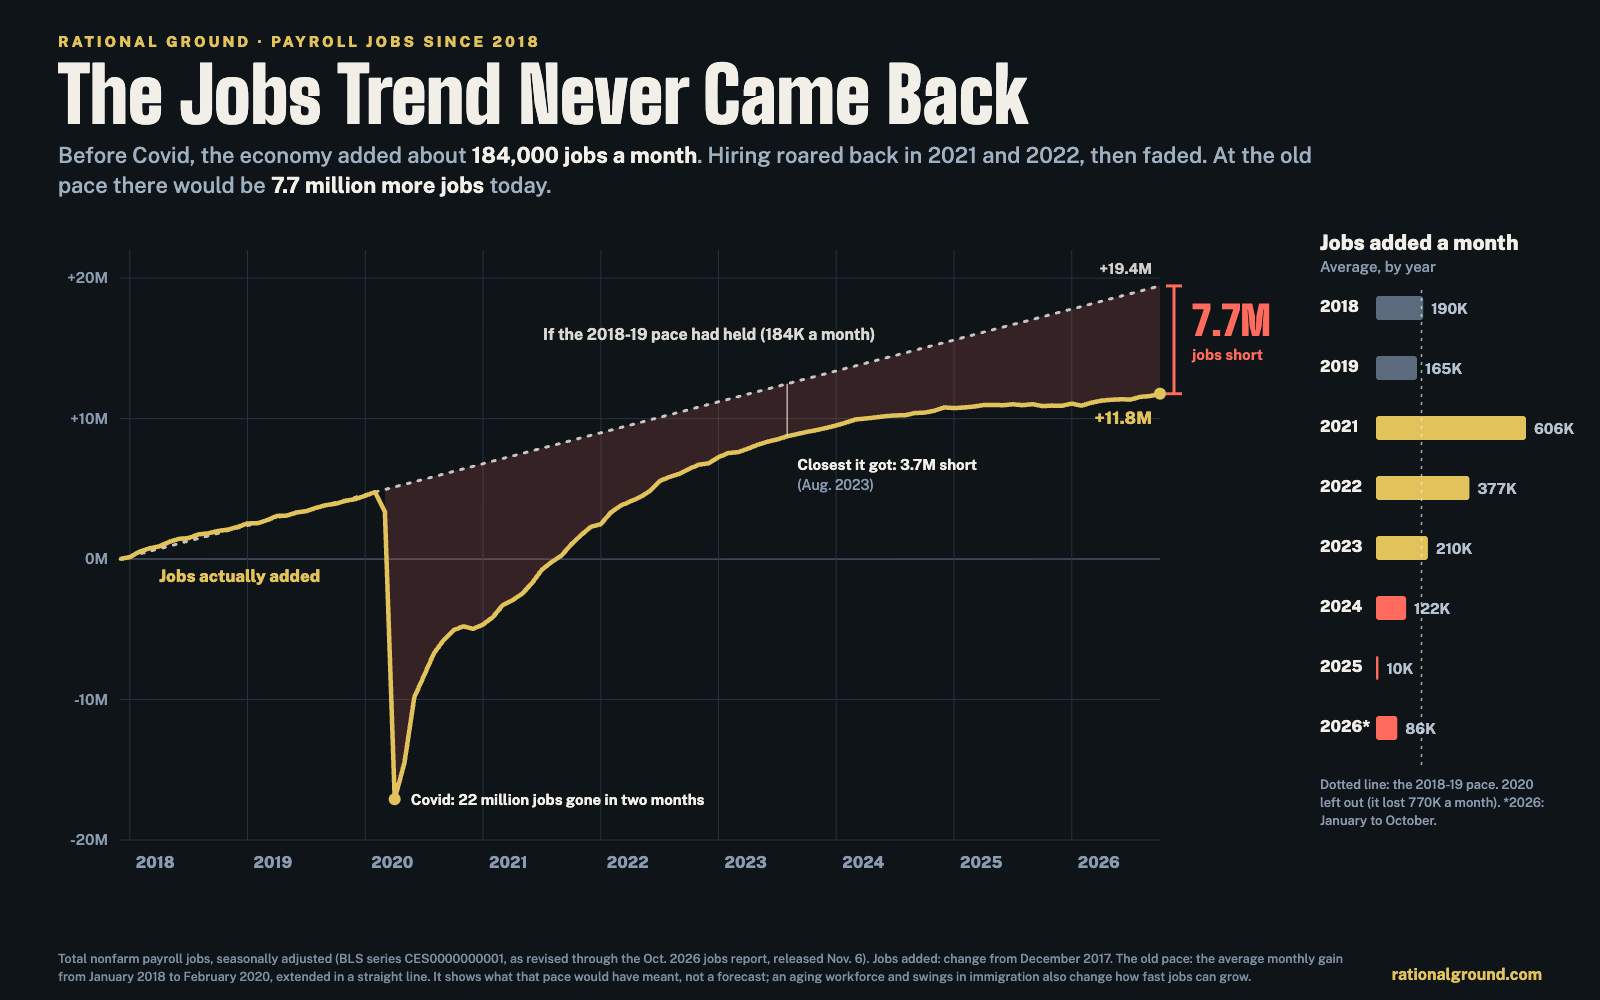
The Jobs Trend Never Came Back: Before Covid, the economy added about 184,000 jobs a month. Hiring roared back in 2021 and 2022, then faded. At the old pace there would be 7.7 million more jobs today.
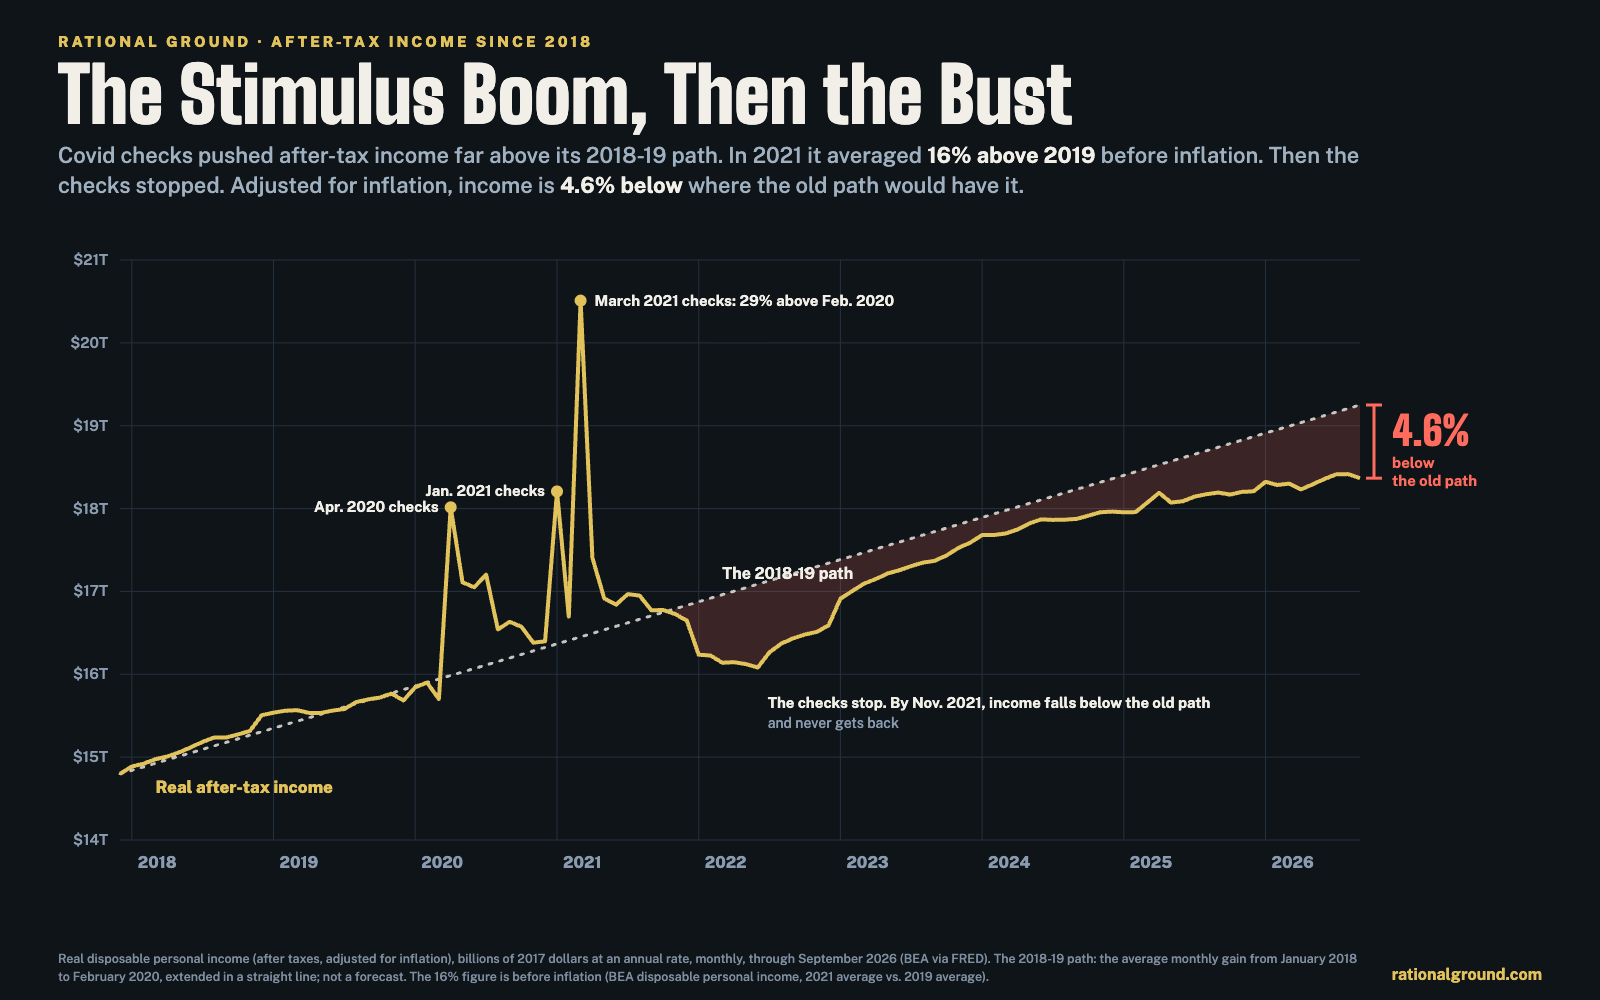
The Stimulus Boom, Then the Bust: Covid checks pushed after-tax income far above its 2018-19 path. Then the checks stopped. Adjusted for inflation, income is 4.6% below where the old path would have it.
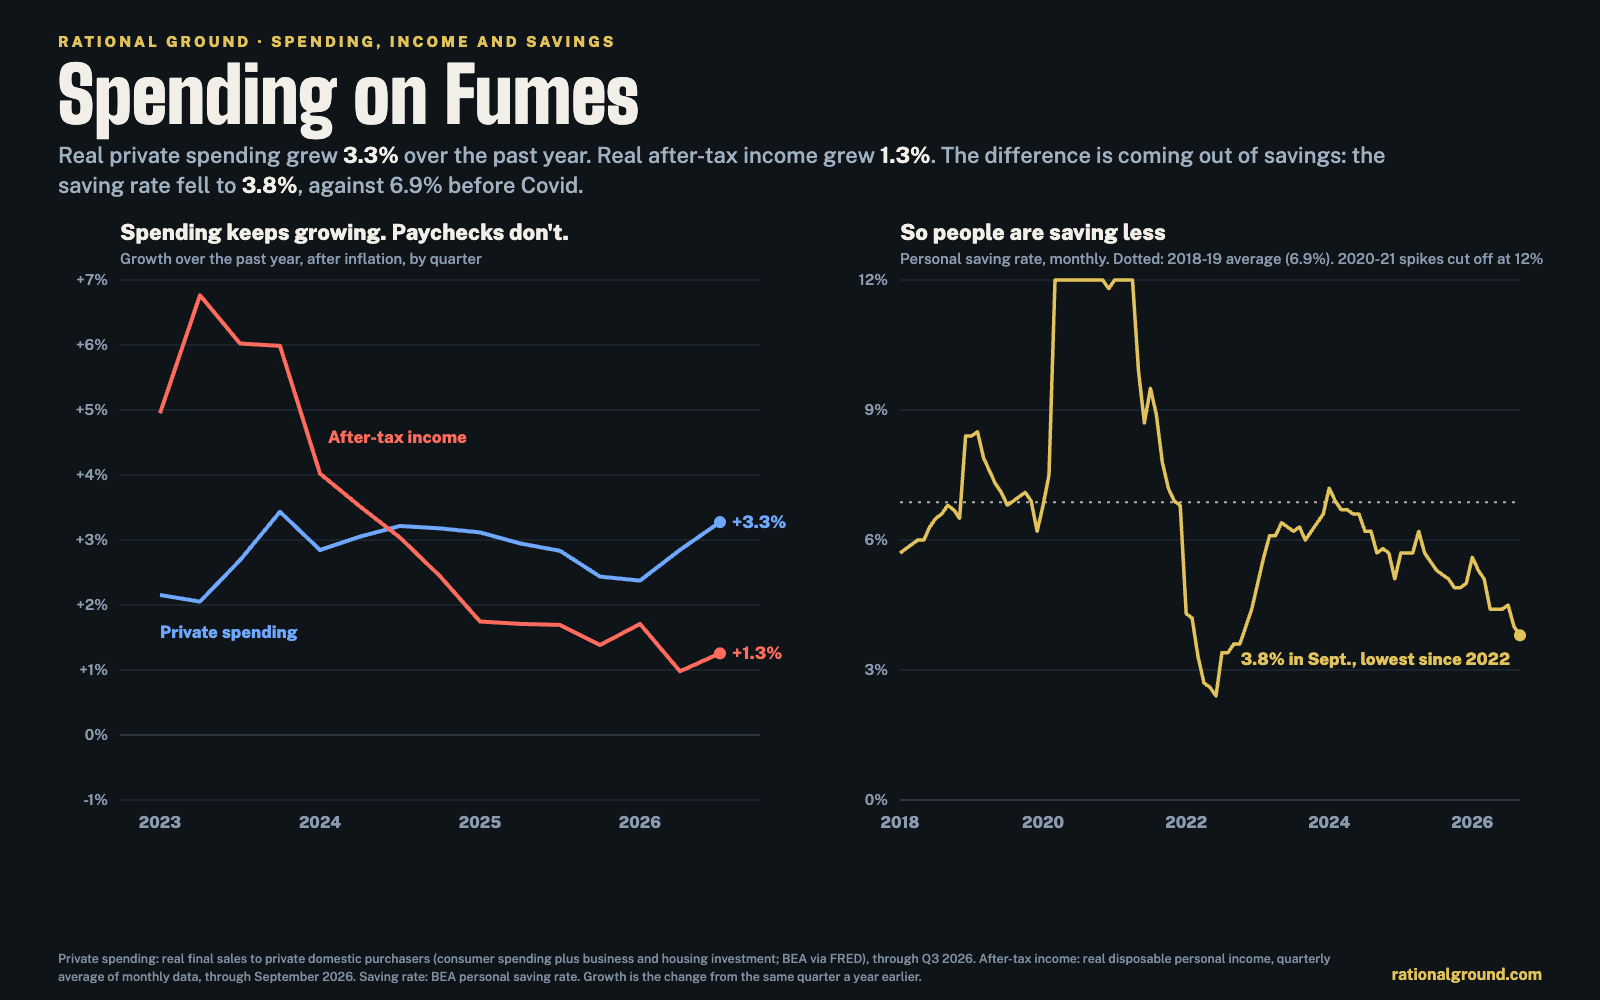
Spending on Fumes: Real private spending grew 3.3% over the past year; real after-tax income grew 1.3%. The difference is coming out of savings: the saving rate fell to 3.8%, against 6.9% before Covid.
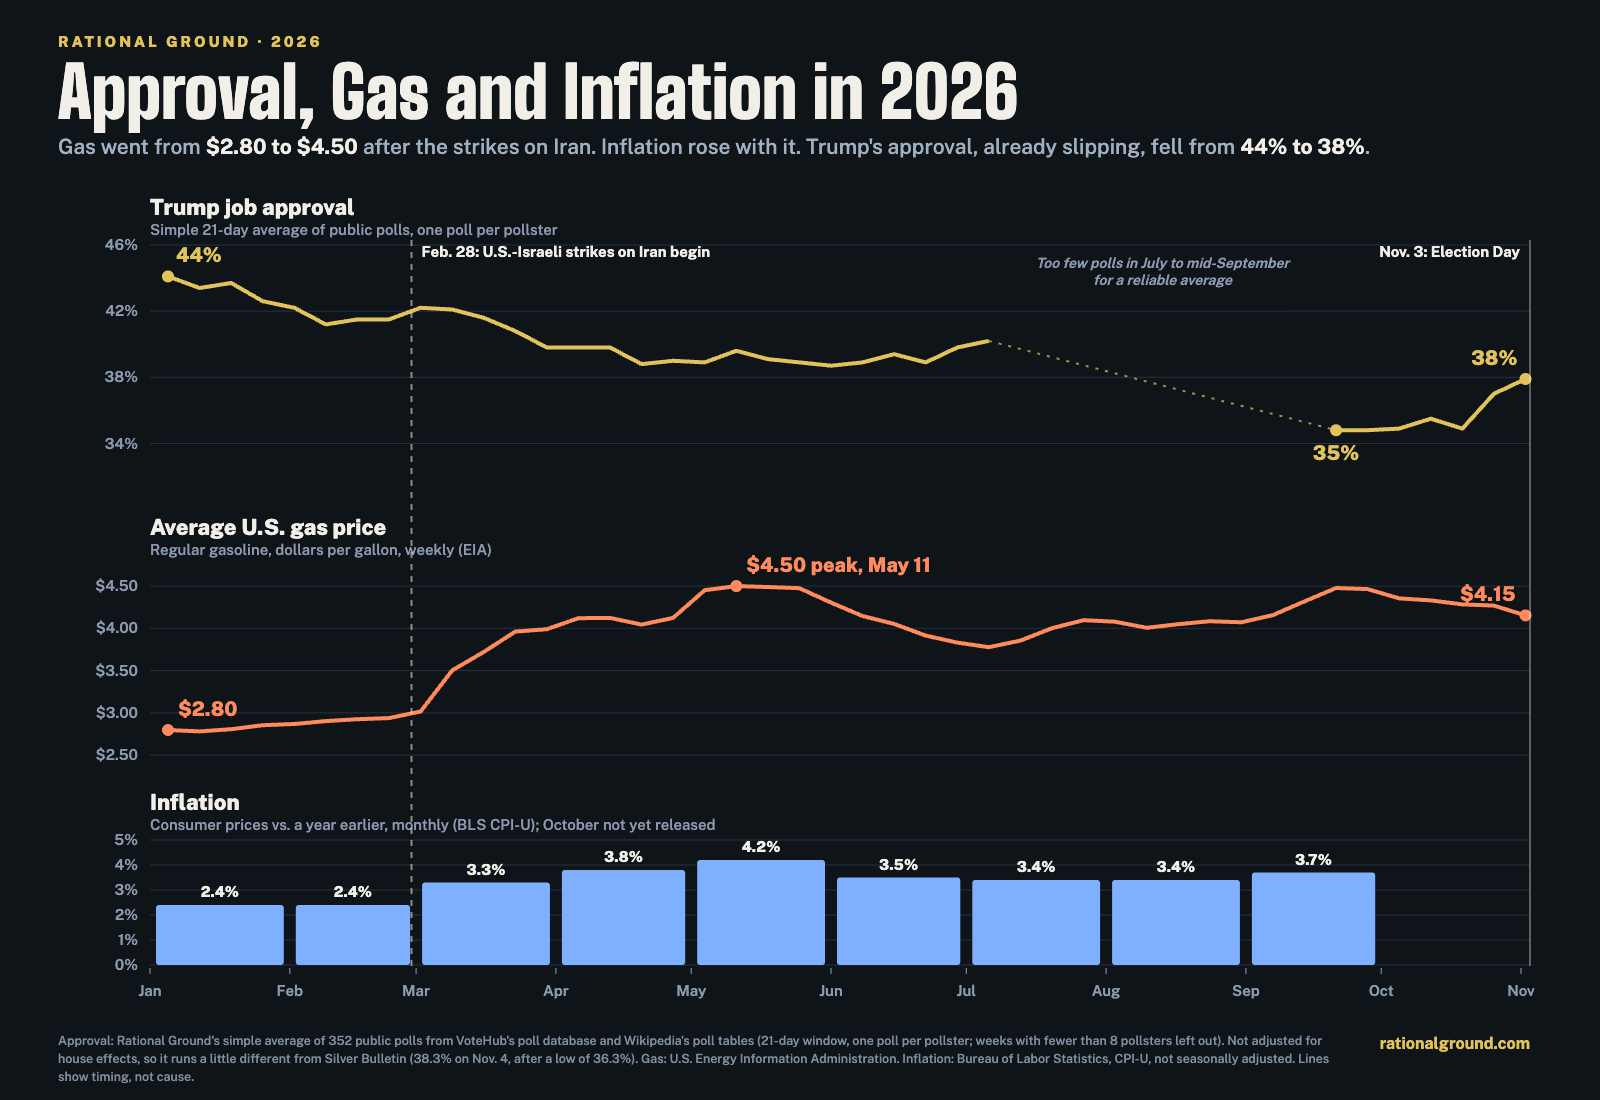
Approval, Gas and Inflation in 2026: Gas went from $2.80 to $4.50 after the strikes on Iran. Inflation rose with it. Trump's approval, already slipping, fell from 44% to 38%.

Our interactive economy pages

Published in August and not updated since.

How the economy moved the vote: Who voted, who switched, who stayed home. More free charts on the Rational Ground members home.