Part 1. What each side voted on
The network exit poll (SSRS; CNN, NBC, Fox, AP). Split by how people voted for the House
| Republican voters | Democratic voters | |
|---|---|---|
| Top issue facing the country (pick one of six) | Economy 41%, immigration 28%, democracy 15%, healthcare 6%, crime 6%, foreign policy 4% | Democracy 47%, economy 37%, healthcare 10%, foreign policy 3%, immigration 2%, crime 1% |
| Cost of living "crucial" to my vote | 37% | 59% |
| Government corruption "crucial" | 44% | 63% |
| Immigration enforcement "crucial" | 47% | 28% |
| War in Iran "crucial" | 21% | 45% |
| AI and data centers "crucial" | 16% | 28% |
| Was Trump a factor in your House vote? | Yes 38%, no 62% | Yes 78%, no 22% |
| U.S. military action against Iran was... | Right decision 77%, wrong 22% | Right 5%, wrong 95% |
Source: CNN's national House file (stamped Nov. 4, 11:30 a.m. ET; unchanged as of Nov. 7).
Other polls with a party split
| Poll | How split | Republicans | Democrats |
|---|---|---|---|
| Economist/YouGov, Nov. 4-6 (post-election; 3,166 registered voters). Open-ended "most important factor," coded | Party ID | Party loyalty 27%, the economy 14%, "opposition to extremist ideology" 11%, social and cultural issues 7%, candidate qualities 7%. Opposition to Trump 3% | Party loyalty 27%, opposition to Trump 19%, the economy 12%, corruption and democracy 7%. Foreign policy and war: 1-2% on both sides |
| Same poll: "Was one reason for your vote...?" | House vote | To support Trump 34%; not a factor 63% | To oppose Trump 82% |
| Narrative Strategies/535 News (Oct. 24-Nov. 3, weighted to the exit poll) | Party ID with leaners | Inflation and cost of living 63%, jobs and economy 35%, immigration 33% (up to three picks) | Inflation 64%, democracy and accountability 42%, jobs 35% |
| Same poll: most responsible for rising costs (pick two) | Party ID with leaners | Gas prices 38%, Iran war 33%, government spending 22%, tariffs 21% | Iran war 55%, tariffs 53% |
| Cygnal, Oct. 23-24 (pre-election; 1,500 likely voters) | Party "type" | Trump Republicans: immigration 37%, economy 20%. Traditional Republicans: economy 28%, immigration 24% | Traditional Democrats: economy 37%, democracy 16%. Progressives: economy 33%, democracy 32% |
| Echelon, Oct. 15-19 (pre-election), open-ended | Party by age | Economy and cost of living 61% (under 50), 40% (50+) | Economy 55% (under 50), 47% (50+); democracy/opposing Trump 24% (50+) |
| UnidosUS/BSP (Latino voters only) | Party ID | Cost of living 56%, jobs 35% | Cost of living 59%, jobs 34% |
What the polls agree on. The economy is first or second for Republicans in every poll. Democracy and opposing Trump are far bigger for Democrats. Immigration is the one issue Republicans cared about clearly more. Trump was a much stronger motive against than for: the exit poll (78% vs 38%) and YouGov (82% vs 34%) match closely.
Where they differ. Polls that let people pick several issues (Narrative/535, UnidosUS) show both parties naming the cost of living at the same rate. The difference shows up only when voters must pick one.
Cautions: the exit poll splits issues by vote, not party ID. Cygnal and Echelon numbers were read from chart images.
Part 2. Switched, or stayed home?
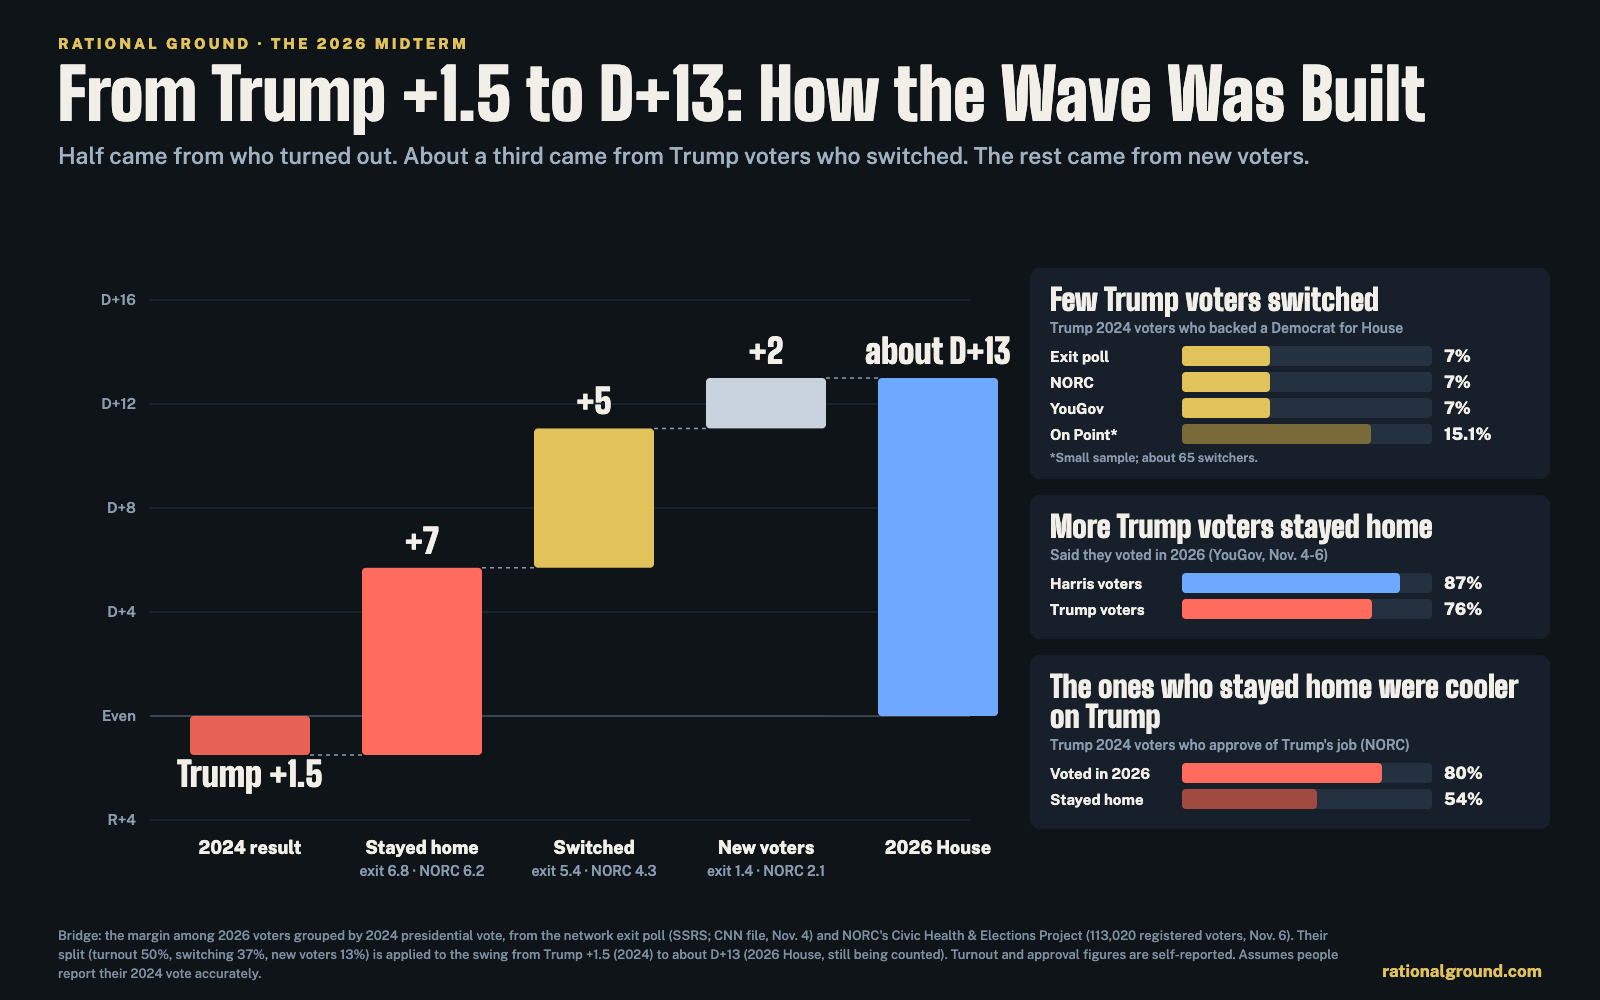
Switching: three surveys agree on about 7%
| Source | Trump 2024 voters who voted D for House | Harris 2024 voters who voted R |
|---|---|---|
| Network exit poll (SSRS) | 7% | 2% |
| NORC Civic Health & Elections Project (113,020 registered voters; weighted to the count) | 7% (91% stayed R) | 3% |
| Economist/YouGov, Nov. 4-6 | 7% (85% stayed R; 5% skipped the House race) | 2% |
| On Point Polling, Nov. 6 (1,088; newer firm, forced to match the count; about 65 switchers in the sample) | 15.1% | about 4% |
Three large, separate surveys say 7%. On Point's 15% is the outlier and rests on a small group.
Staying home: every survey points the same way; the size is uncertain
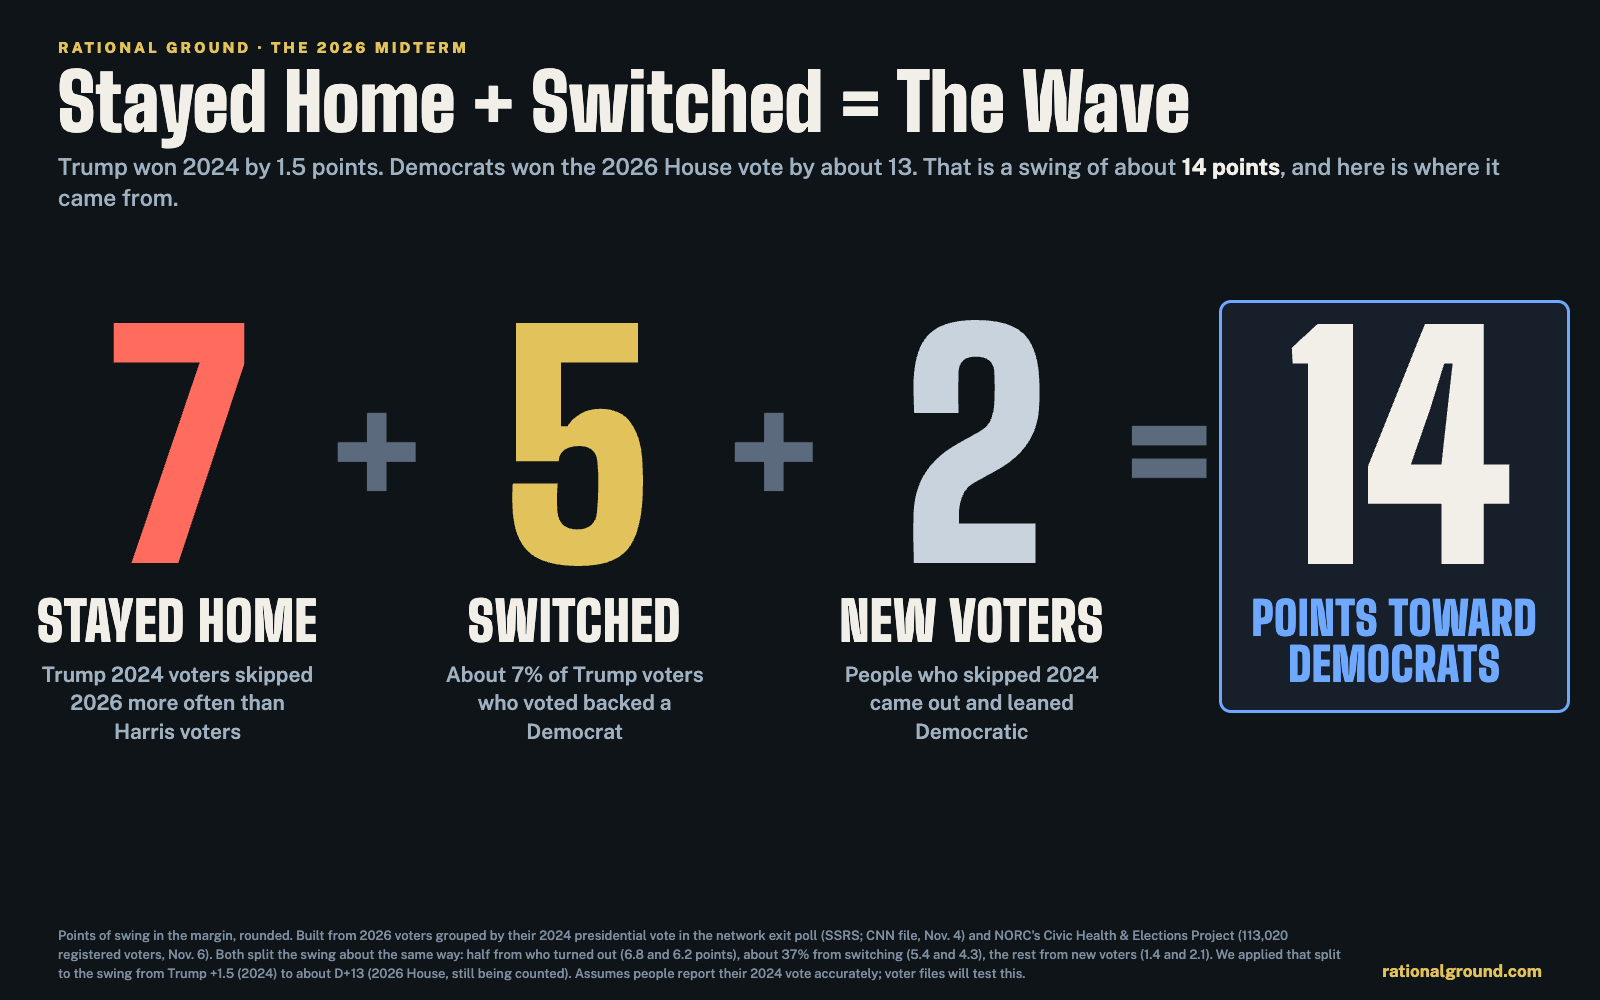
1. Who showed up, by 2024 vote. Trump won 2024 by about 1.5 points. Yet the 2026 electorate leaned Harris:
| Source | 2026 voters' 2024 vote | Harris lead among 2024 voters |
|---|---|---|
| Network exit poll | Harris 49%, Trump 44% | about +5 |
| NORC | Harris 43%, Trump 39% (15% skipped 2024) | about +5 |
| Actual 2024 result | Trump 49.8%, Harris 48.3% | Trump +1.5 |
Two separate surveys give the same tilt: about 6 points toward Harris voters. Caution: some of this could be people misremembering, or not admitting, a 2024 Trump vote they now regret. Pollsters call this recall bias.
2. Self-reported turnout, by 2024 vote.
| Source | Trump 2024 voters who voted in 2026 | Harris 2024 voters who voted |
|---|---|---|
| Economist/YouGov (asked after the election) | 76% | 87% |
| NORC (its voter model) | 90% | 94% |
| Patrick Ruffini's estimate from county turnout (an analyst's estimate, not a survey) | about 70% | about 90% |
Surveys always overstate turnout, because people who take surveys vote more. Read these as the direction and a rough range: Trump voters skipped 2026 noticeably more often.
Counterweight from NORC: people who voted Republican for the House in 2022 turned out at about the same rate as 2022 Democratic voters (93% vs 94%). Self-described Republicans and Democrats voted at about the same rate (65% vs 63%). So the turnout gap is concentrated among Trump's 2024 voters, many of them newer or less-attached Republicans. It is not a collapse of the party's regular midterm voters.
3. Hard data (counts and voter files, not surveys).
- Florida, final turnout by party registration: registered Democrats about 68%, registered Republicans about 63%.
- Georgia voter file (Brennan Center, Nov. 6): "Over 29 percent of white voters who cast a ballot [in 2024] stayed home this week; the same was true of just 24 percent of Black voters." This is a split by race, not party.
- Texas: our research team found reports that the Republican Senate nominee's raw vote fell far below Cruz's 2024 total while the Democrat's rose. Counts are incomplete, and raw totals can't separate switching from staying home.
4. A different read: persuasion did more. Dave Wasserman of the Cook Political Report says the result was "far more about persuasion and the disintegration of the Trump coalition than it was about differential turnout." His test: North Carolina had the biggest turnout drop from 2024 (26%) and swung 23 points toward the Democrat; Texas had the highest turnout (87% of its 2024 electorate) and swung even more, 26 points. He still sees "a disproportionate drop in Republican participation" (Cook post-election briefing, Nov. 5). Our split rests on what people say they did in 2024, so it could overstate staying home. That's why the voter-file check below matters.
Why they stayed home
NORC, 2024 Trump voters who skipped 2026 (about 1,750 respondents).
- They approved of Trump's job 54% to 44%. Trump voters who did vote approved 80% to 20%.
- 58% call themselves Republicans; 35% call themselves neither party.
- Reasons "that might prevent you from voting":
- "I don't like the candidates": 27% (Harris voters who skipped: 18%)
- "My vote doesn't matter": 26% (Harris skippers: 20%)
- "I am not interested in politics generally": 25%
- "I don't think my vote will be counted accurately": 14%
- "It takes too much time to vote": 9%
The wording looks forward, so this was probably asked before Election Day.
Economist/YouGov, non-voters asked after the election (open-ended answers, coded). Trump 2024 voters, n=128, a small group.
- Couldn't access a ballot 19%, don't trust the system 19%, no time 17%, health problems 17%, disliked the candidates 17%, not interested 7%.
- 37% of them wish they had voted; 53% don't mind that they didn't.
On Point, all non-voters. "Not interested, felt their vote would not matter" 25.3%; too busy 17.0%; didn't like the candidates or issues 16.7%. Its non-voters split evenly between the parties (33.3% R, 32.7% D).
What party figures said (opinion, not data). Ron DeSantis, quoted secondhand: "A lot of our voters stayed home because they were frustrated with the lack of productivity from Republicans in the House and Senate." We have not found the original.
The Trump wing is shrinking (a tracking poll, not a vote survey). Each month, RMG Research for Napolitan News asks voters which of four candidates they would prefer if all had equal skills and temperament. In October (4,110 registered voters), a Republican with Trump's policies got 26%, a traditional Democrat 24%, a traditional Republican 21% and an AOC-style Democrat 19%. The Trump-style choice was 35% in July 2025; 26% is its lowest since the question began in 2020. Scott Rasmussen, who runs RMG and Napolitan, posted that among white men it fell from 49% to 32% since January 2025, with those leaving split about evenly between traditional Republicans and traditional Democrats. (The subgroup numbers are in his post only; the public release has the topline.) That fits the picture above: the party lost the edges of the Trump coalition, and they went both ways. Sources: Napolitan News; Rasmussen on X.
Reading it together. The Trump voters who stayed home were not loyal MAGA voters who forgot to show up. They were cooler on Trump, less tied to the party, and more turned off by the candidates. That fits the switchers' story: the same discontent moved some Trump voters to vote Democratic and kept others home.
How we can check it ourselves
- North Carolina voter file. Free. It lists each voter's party registration and vote history back 10 years. The statewide history file was last updated Nov. 2. Nov. 3 votes should start appearing in the next weekly update (around Nov. 8), and counties may take weeks to finish. Test: of people who voted in the 2020, 2022 and 2024 general elections, what share of registered Republicans vs Democrats voted in 2026, and how does that compare with 2022?
- Florida voter extract. Party plus vote history. Available on request; official 2026 history likely lands in December.
- Ohio and Georgia. Their state sites blocked our automated check. Ohio's party field is based on primary ballots.
- Catalist, TargetSmart, Pew validated voters. These are the gold standard. They usually come out months later.
Part 3. How groups voted: the exit poll against other sources
The exit poll is one survey, even though CNN, NBC, Fox and AP each publish it. These are the other sources we could line up. Numbers are the Democratic margin (D minus R) for the House.
- NORC: 113,020 registered voters, weighted to the vote count, as of Nov. 6.
- NYT: Times Voter Trends, a preliminary model. We could read it only from screenshots, because the Times page was blocked.
- YouGov: Economist/YouGov, Nov. 4-6.
- UnidosUS/AARC: the UnidosUS, BSP Research and African American Research Collaborative study, with separate Latino, Black, Asian American and white samples.
On Point and the AtlasIntel pre-election poll are in the notes but left out of the average.
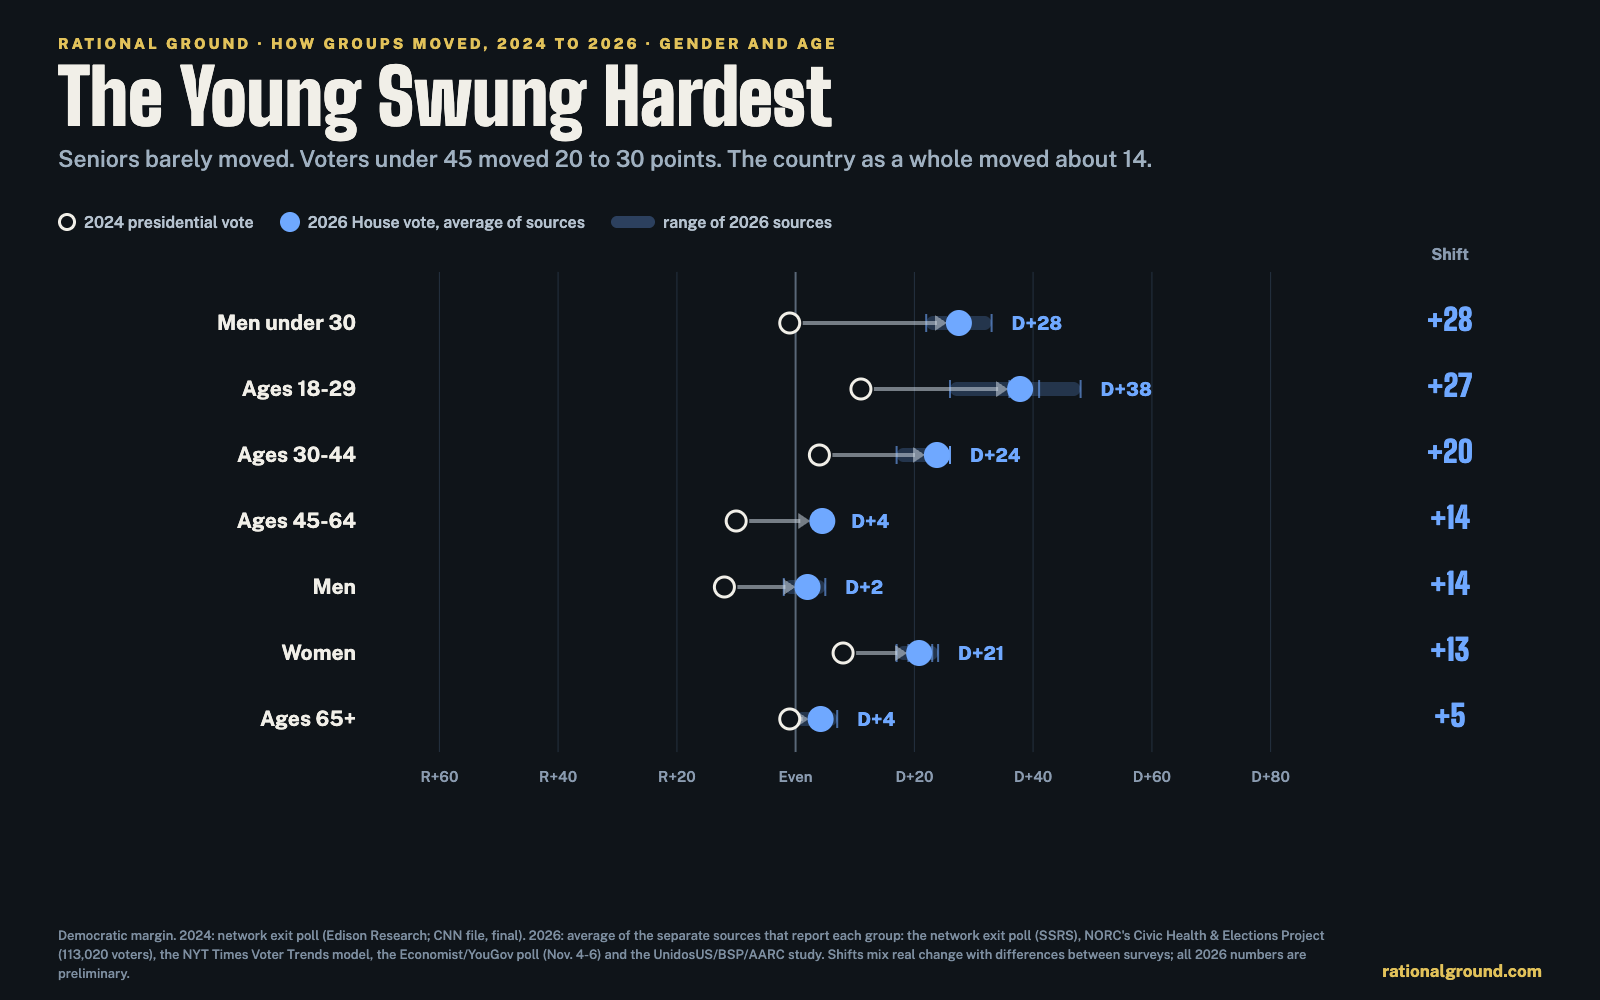
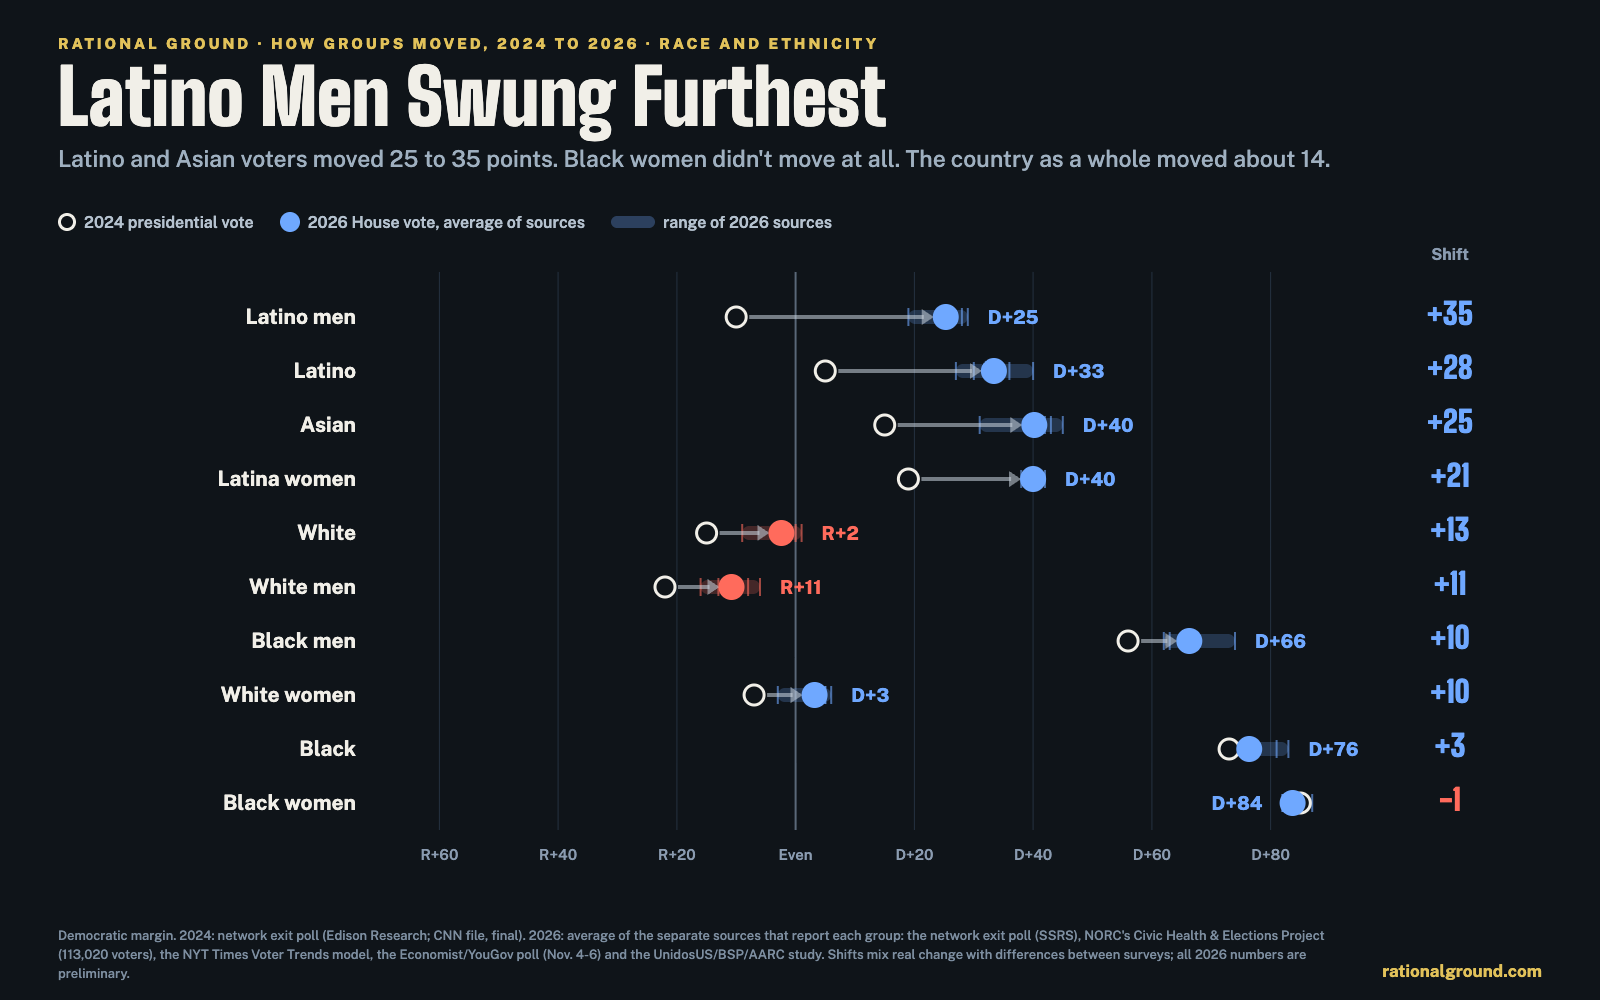
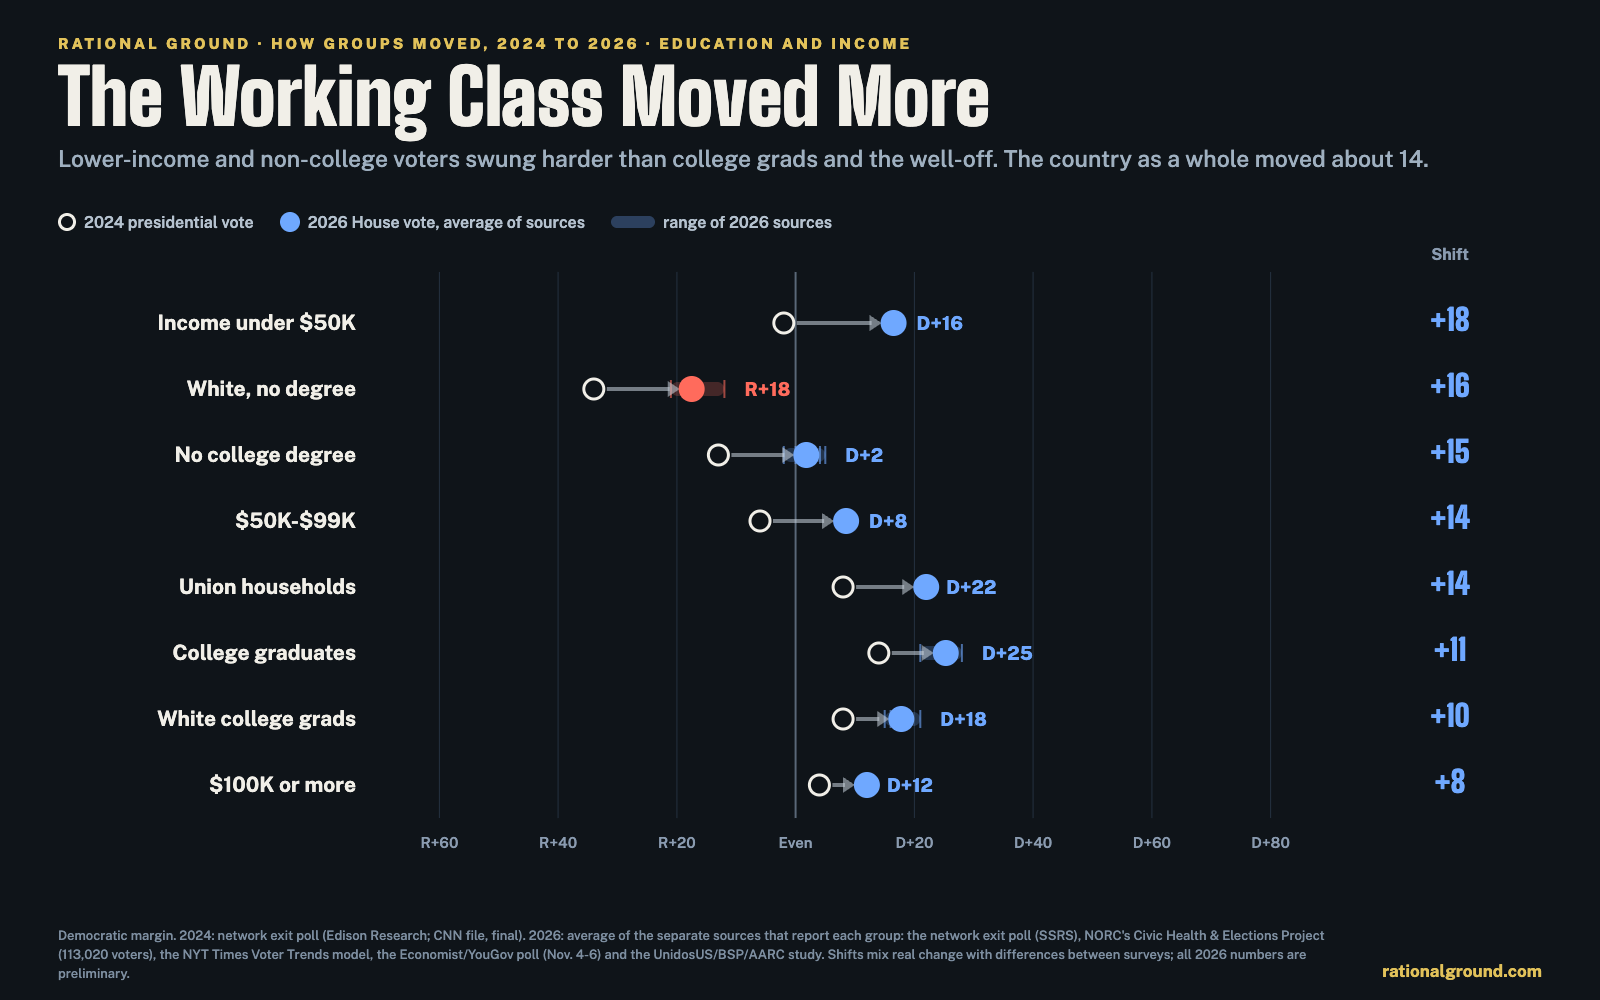
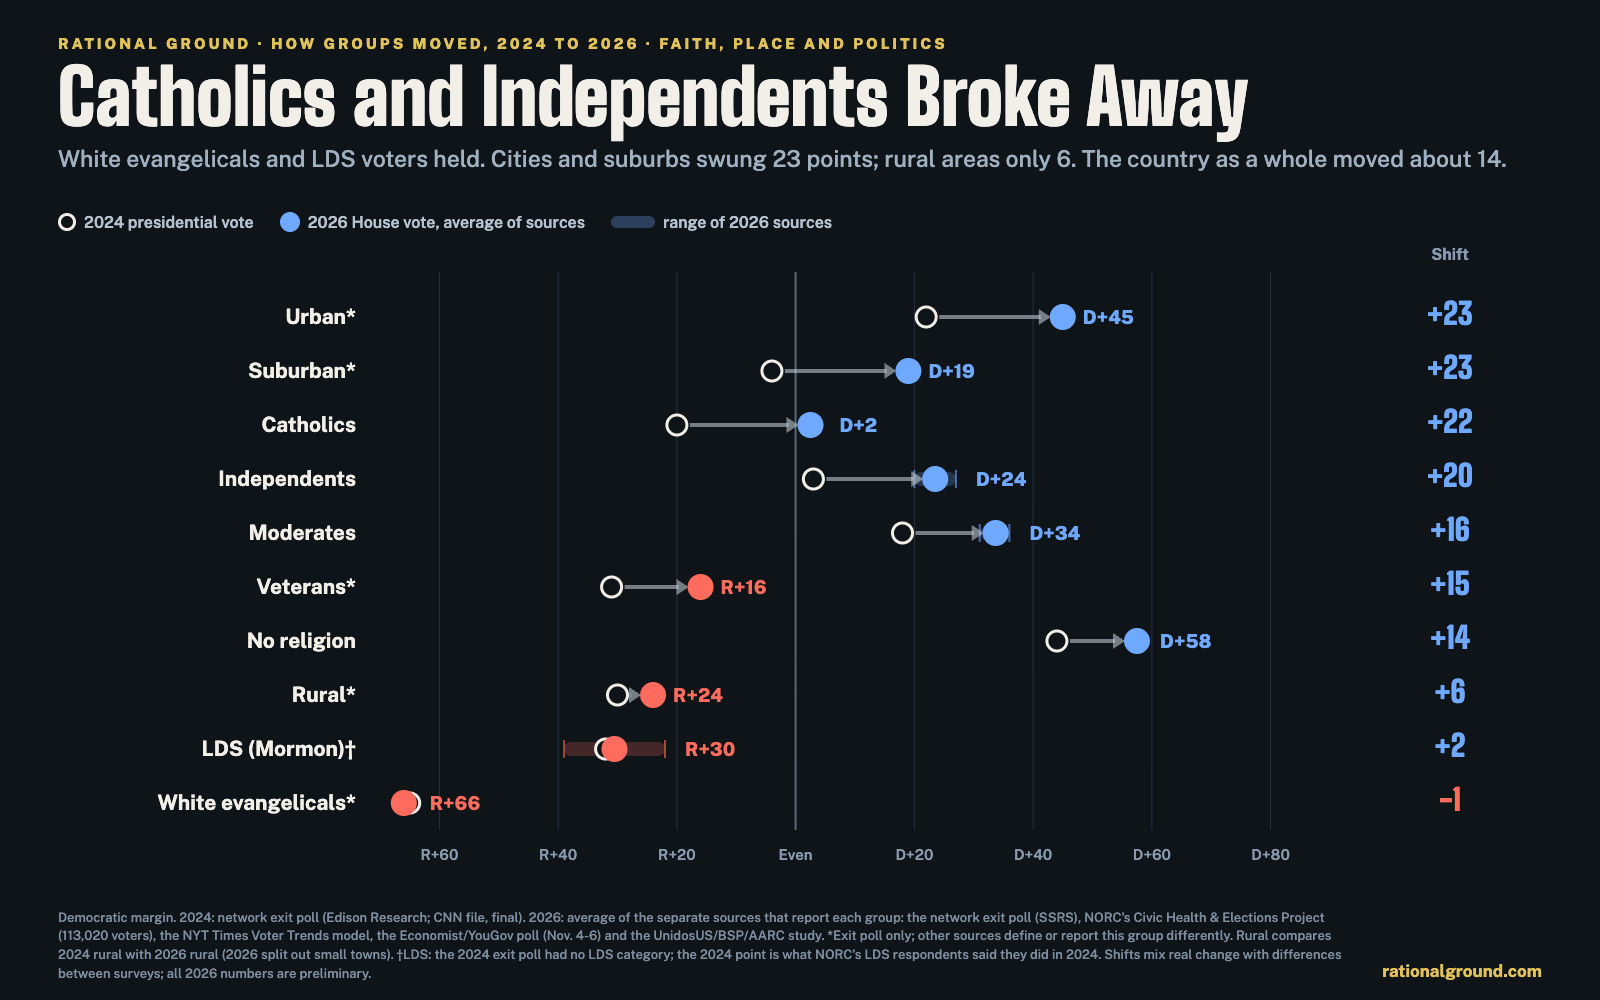
The shifts, group by group. Open dot: the 2024 presidential vote (2024 exit poll). Solid dot: the 2026 House vote, averaged across the sources that report each group. Shaded bar: the range of those sources.
| Group | Exit poll | NORC | NYT | YouGov | UnidosUS/AARC | Average | Exit poll vs others |
|---|---|---|---|---|---|---|---|
| Men | D+2 | D+5 | D+3 | R+2 | D+2 | matches | |
| Women | D+19 | D+17 | D+23 | D+24 | D+21 | matches | |
| White | tie | D+1 | R+3 | R+1 | R+9 | R+2 | close |
| Black | D+81 | D+74 | D+83 | D+72 | D+72 | D+76 | exit a bit high |
| Latino | D+30 | D+34 | D+40 | D+27 | D+36 | D+33 | matches |
| Asian | D+43 | D+45 | D+42 | D+31 | D+40 | matches | |
| White men | R+8 | R+6 | R+13 | R+16 | R+11 | close | |
| White women | D+6 | D+5 | D+5 | R+3 | D+3 | close | |
| Black men | D+74 | D+63 | D+62 | D+66 | exit high | ||
| Black women | D+87 | D+82 | D+82 | D+84 | close | ||
| Latino men | D+19 | D+28 | D+29 | D+25 | exit low | ||
| Latina women | D+38 | D+40 | D+42 | D+40 | matches | ||
| Ages 18-29 | D+48 | D+36 | D+41 | D+26 | D+38 | exit high | |
| Ages 30-44 | D+26 | D+17 | D+26 | D+26 | D+24 | matches | |
| Ages 45-64 | D+5 | D+6 | D+4 | D+3 | D+5 | matches | |
| Ages 65+ | tie | D+7 | D+5 | D+5 | D+4 | exit low | |
| College graduates | D+28 | D+21 | D+26 | D+26 | D+25 | close | |
| No college degree | R+2 | D+5 | D+4 | tie | D+2 | exit low | |
| White college grads | D+21 | D+15 | D+16 | D+17 | exit high | ||
| White, no degree | R+21 | R+12 | R+19 | R+17 | exit low |
How the averages were figured:
- The average is a simple mean of the sources in each row, rounded to the nearest point.
- NYT's college and no-degree figures combine its separate categories, weighted by each one's share of voters.
- YouGov counts self-reported voters. Its percentages leave out "other" and "not sure."
What this says.
- The big story holds in every source: women strongly Democratic, men about even, Latino and Asian voters about two-to-one Democratic.
- The exit poll's most-quoted number, young voters D+48, is the highest of four. The average is about D+38.
- Its "seniors tied" is the lowest. The other three have seniors D+5 to D+7.
- Its education gap is the widest. The other sources show a smaller divide between college and non-college voters.
- Black men: the exit poll has D+74. Both independent studies have about D+62 to D+63.
- Latino men: the exit poll has D+19, but two other studies have about D+28.
Shares of the electorate also differ. Use these with care.
- 65+: 36% in the exit poll, 35% in NORC.
- Black voters: 9% in the exit poll, 10% in NORC.
- White voters: 73% in the exit poll, 78% in NORC.
- College graduates: 47% in the exit poll, 45% in NORC.
Not out yet: Pew validated voters, Catalist, AP's own analysis, state voter files.